Central Bank Rallies and Just How Big is IG9?
Nothing like having the first “central bank put” rally before the U.S. is even fully awake. Spanish 10 year yields got as high as 6.13% and then bounced back to almost 6.05%. That rally is ending already as there is no real indication of central bank intervention and liquidity is extremely thin.
The 5 year part of the curve is getting very interesting as well. Spanish 5 year bonds were briefly above 5% and seem destined to head back that way at any moment. That is another significant psychological level and shows how little the LTRO is able to accomplish on a long term basis. These bonds were yielding less than 3.5% on March 1st. Spanish 5 year bond yields are now also 22 bps higher than Italian 5 year bond yields – showing once again that CDS was correct and was not as manipulated as the bond markets were. The CDS curves never had Spain trading tighter than Italy. The bond market did, but that was a function of the fact that Spain has less debt, so was more easily manipulated with LTRO purchases.
So futures have already trading in a 10 point range, from an overnight low of 1,360 to a high of 1,371. I think we are near the end of this brief “hopium” bounce. There is a lot of data coming out that is important to watch. I don’t think we will see a “bad news means QE” trade today, so bad news will actually be negative for stocks. Maybe we will be surprised to the upside (and even meeting expectations could probably be considered a surprise) but I doubt it. I think we will breach last week’s intraday lows this week, with far more risk of a cascading sell-off as investors long and “hedged” with the “Bernanke put” start to question the strike price and take some risk off the table.
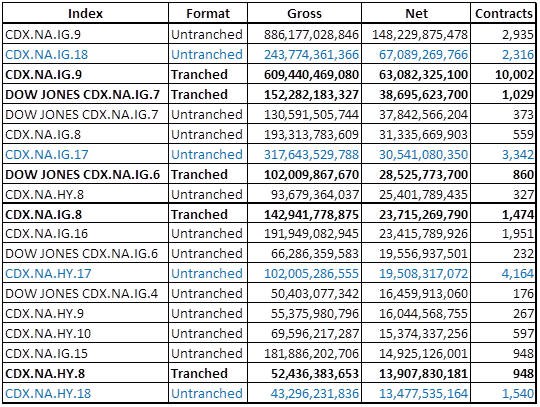
Fixed income markets generally seem quiet. So far they have behaved well with debt further from the epicenter of Spain and Italy holding on to value. Big questions remain on what the technicals will be from the whole IG9 trading “scandal”. I think IG9 will underperform, HY CDS will outperform, but it is difficult to figure out. This is a big deal to the market because of the size of IG9. In spite of the impression that it is an old, off the run, stale index, it is huge and this is not a new phenomena.
The Gross Notional of IG9 outright and IG9 tranched are over $1.5 trillion. That is almost half of the gross notional outstanding of the top 20 index positions. Why that hasn’t been cleaned up is beyond me, but it should catch the eye of regulators. IG9 has the largest net position and IG9 tranches have the 3rd largest net position. How much of that sits in “correlation” desks where they have bought the tranche and sold the index? That is probably where a lot of the risk sits, and while not likely to be a ticking time bomb, might be something worth looking at for the industry as a whole. I would be nervous that so many of the biggest outstanding positions are off the run indices and directly linked to tranche trades. Even on high yield, we see some old indices, which had more active tranche markets, pretty high up on the net exposure list. The size of the tranche market, the amount of “correlation” hedging, and just the absurdity of huge gross notionals versus net notionals should be examined. If this was an exchange traded product the “notionals” issue would go away. The position of tranches vs index is another one that seems particularly large, based on the fact that the tranched and untranched indices seem to show up as “pairs” in this list.
So, whatever the outcome of the JPM positions, expect some big potential moves in CDS, particularly if they start unwinding (which I doubt they will). And if you get big moves in CDS, don’t expect the cash markets to be totally unaffected. My gut tells me that the biggest winners will be high beta high yield names, and the biggest losers will be very low beta IG names.

