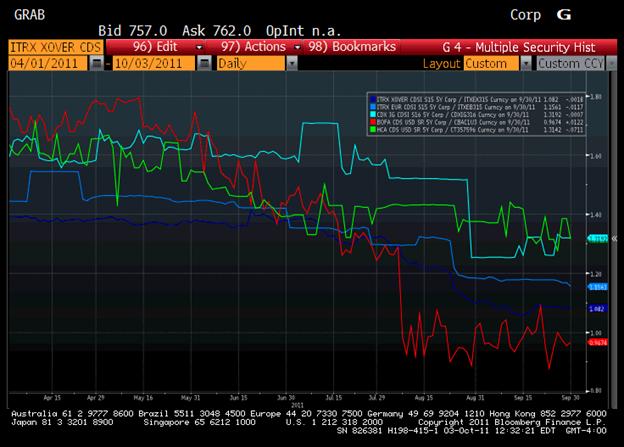
Curve Flattening In Credit – Never a Good Sign
The credit markets here are actually deteriorating and are showing signs that there is growing default concern, rather than just pressure to reduce risk.
The red line is the ratio of BAC 5yr CDS vs 3yr CDS. It was the first curve to flatten. The dark blue line is the European XOVER index. As European sovereigns weakened, XOVER started to trade flatter as concern spread to how the weaker companies in Europe would be able to fund themselves and if sovereign defaults would hurt their business.
It took MAIN longer to follow suit. Initially MAIN was dragged down by its financial component but has continued to deteriorate as some degree of fear has spread from financials and European HY into European corporates.
The light blue line is the North American Investment Grade Index (IG16). IG remained immune to front end curve pressure, but in late August we saw a move there too. This index has few financials than MAIN and should be the safest of all. Seeing any front end pressure in IG16 is definitely concerning and shows that there is more than just some momentum chasing global macro players driving spreads around.
HCA, a benchmark High Yield Issuer, was cruising along until mid September. Now it too is finding pressure on front end spreads. This is occurring across the board on High Yield names. That makes sense with NewPage having defaulted recently and Eastman Kodak suddenly at risk.
The pressure on curves in high yield correlates well with the underperformance of CCC bonds. Both of these moves suggest that there is real risk aversion. If investors only wanted liquidity they could sell some of the bonds that have performed better. If they weren’t hedging jump to default exposure, they wouldn’t be starting to bid up the front end of the curve. Investors are examining their positions closely and are exiting the positions they fear the most in an economic downturn.
Could this move be purely because the curves are illiquid? Yes, CDS curves are relatively illiquid on single name, but for the past year, they have been illiquid because there were only offers of protection. No one was looking to buy short dated protection – everyone had jumped onto the economy is okay and corporations have a lot of cash bandwagon. 4 months ago, the market, particularly in indices could have absorbed a big buyer of short dated protection. Now it is moving wider on thin volumes. You could take that as a sign only of illiquidity, but I think there is more going on here than just that. Any time a market goes for offered without to threatening to go bid without, it is not just a function of a few errant trades.
On a somewhat related note, multiple people have commented how illiquid 5 year CDS is, or how easily it is pushed around, etc. That is largely because 5 year CDS on many names is now moving in a direction that doesn’t suit many commentators or analysts. In most names, the CDS is as liquid as the bonds. For many names it is easier to move around the bonds than it is the CDS. From what I can see, it remains easier to find an offer on CDS than to find a bid on bonds for many companies. CDS might have 99 problems, but liquidity isn’t one. Certainly not when comparing 5 year CDS to bonds. On the other hand, maybe no one would be as concerned about CDS if they spoke about it in “points” rather than spread. MS went 5 year CDS, on a 100 bps SNAC contract, went from 83.1 points up-front to 82.2 points up-front. That is the up-front payment required for spreads of 505 and 530. Somehow 25 bps sounds a lot worse than 0.9%. Just something to keep in mind about the perception versus reality. The volatility in CDS is actually relatively tame compared to the volatility in the stock – and it should be, since it is structurally senior. I do continue to believe that the action in Morgan Stanley has as much to do with a hard landing for Asia as it does for unique exposure to European banks.

