LIBOR Liar, Pants on Fire. A Look at Barc, BAC, JPM, and Citi
July 2007 to January 2008
Stocks
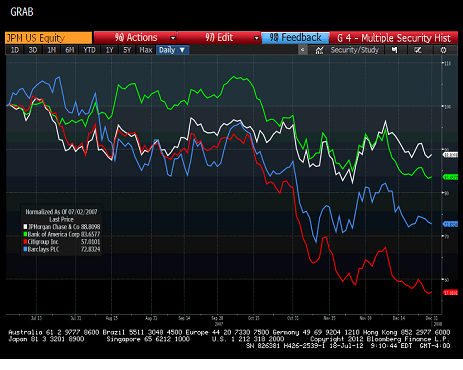
These are the stock prices, “normalized” to 100 in July 2007. In the August swoon, JPM and C did the worst. Barclay’s eventually caught up in later August, while BAC did well. We briefly rallied on a Fed Rate cut in October, but then the swoon returned with C underperforming by far. It was down over 40% in that period. Barclay’s was in the middle, and JPM was actually the best performer, down only 11% by year end.
CDS
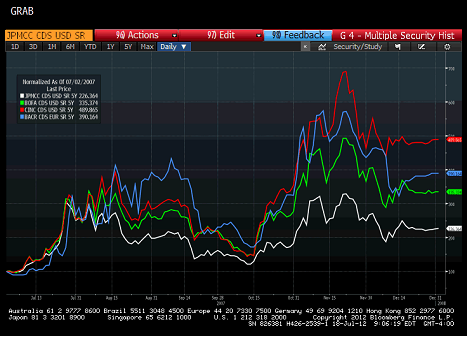
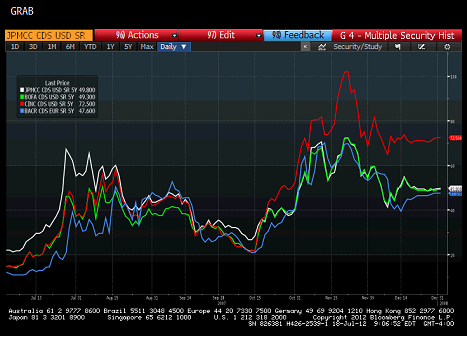
These are “normalized” CDS spreads. You can see that at first they moved in line, then Barclay’s underperformed, but returned to the fold by the time of the Fed rate cut, and then ultimately we saw a separation as JPM did the best (just like in stocks) and Citi did the worst (just like in stocks). But this overstates the divergence a bit. Looking at the outright spreads shows that Barclay’s actually started the period trading tight, and JPM was the widest, but by the end CDS markets viewed JPM, Barclays, and BAC as similar, but Citi was noticeably wider.
LIBOR Submissions
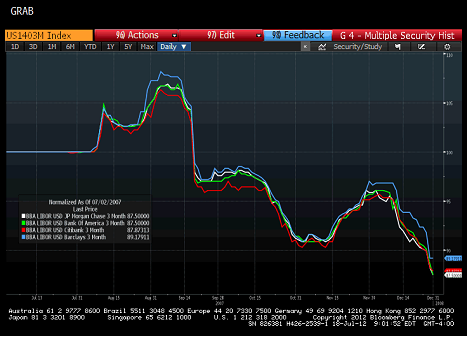
These are “normalized” LIBOR. All banks were submitting very similar rates. Then the stock market decline started and bank LIBOR increased. This was a function of credit spreads. Then as Fed programs kicked in (discount window) and then rate cuts were implemented, LIBOR moved down.
The outlier to me, is Citibank. Citi was the worst on CDS, the worst on stock, but actually did the best on LIBOR? Really? Was Citi really able to borrow from other banks at rates equal to or lower than BAC and JPM? Shouldn’t it have been closer to Barclays? There is the fact that Barclay’s was reliant on BoE rather than the Fed. That is one reason for Citi to more closely track JPM and BAC, but that close? CDS was relatively tame, so maybe the differential in 5 year CDS overstates the issue, but just doesn’t seem right.
August 2008 to January 2009
Stocks
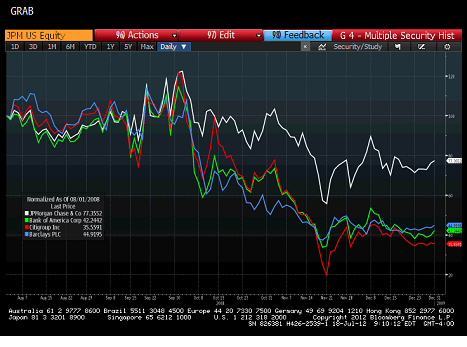
All the banks moved more or less in line at first. Then Citi, Barclays, and BAC underperformed. For one brief moment, Citi actually bounced and got back to JPM levels, then a long slow decline started. Barclays was for awhile the worst performer, but Citi took over, being down 80% at one stage and finishing down 65%. Those are big numbers. Citi, BAC, and Barclays all saw their stock price decline by 55% to 65%. JP was “only” down 23%.
CDS
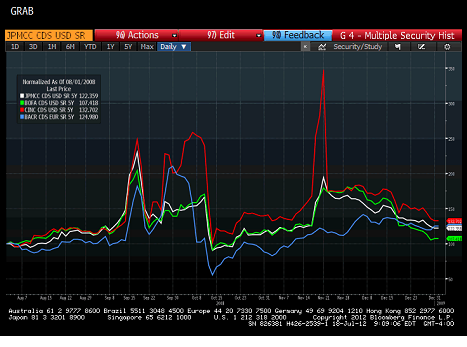
On a “normalized” basis, it’s surprising to see Barclay’s CDS do better than anyone else’s at any time during the period. What is clear, is that on a “normalized” basis, Citi consistently was the worst name. One spike up with JPM, one with Barclay’s, and one big spike all by itself. But maybe like in 2007, the levels were low enough that the differences might be immaterial?
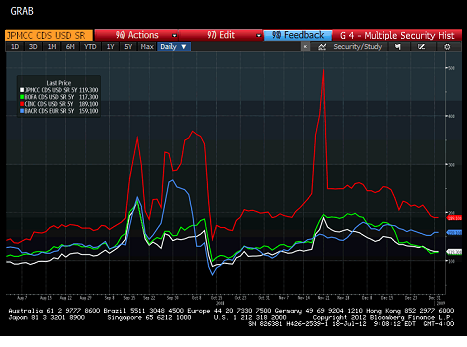
No, these moves in LIBOR are real. Citi started the crisis as the highest spread name, and maintained that “distinction” throughout the entire period. Barclay’s never traded as wide in CDS as Citi. JPM was probably the best, but BAC wasn’t too far behind (though it widened as noise about hidden ML losses came out). Barclay’s was surprisingly not as bad as I would have guessed. Citi though is just clearly the worst.
LIBOR Submissions
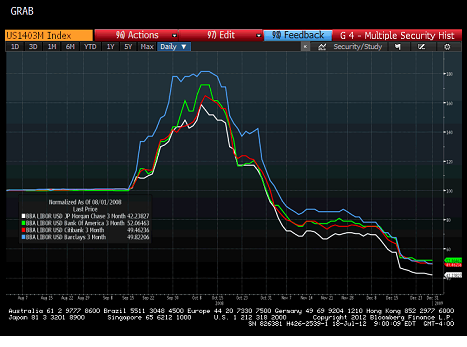
This is “normalized” and Barclay’s is a clear underperformer. You can tell when they were allegedly “told to catch up”, but throughout, they remained the high submitter. They underperformed through the entire crisis. Not quite consistent with stocks or CDS and may explain why they complained that others weren’t submitting “true” rates. Citi was somehow consistently able to submit LIBOR that was lower than BAC but was even lower than JPM on some days. By the end of the year, once Barclay’s was presumably fully in liar mode, they were similar to BAC and C. Maybe it’s the normalization process screwing up the data?
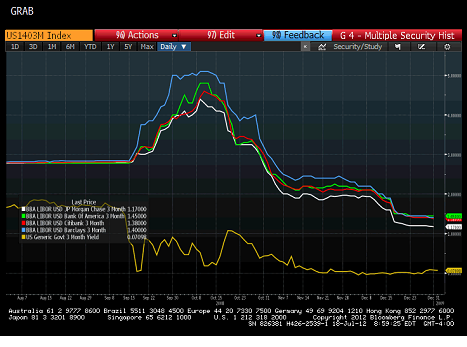
I’ve added the 3 month yield so you can get a sense of the Ted Spread, but it is clear that Citi felt they funded in line with BAC and at times with JPM. It is only at the end when we see Citi, BAC, and Barclay’s submit similar rates.
If Barclay’s said others were lying, who could it be? There were days the separation between the U.S. banks and Barclay’s was as high as 100 bps. 50 bps difference wasn’t uncommon. I can justify JPM trading that much better. The stock market performance and CDS of JPM would all be good explanations of why JPM was better than Barclay’s at funding. That much lower, is a guess, but it actually doesn’t seem unreasonable.
Citi in particular looks bad. Especially since BAC’s spikes in LIBOR coincide at least somewhat to times when their stock and CDS underperformed.
Conclusions
This is only one point in one curve. I have focused so far on 3 month USD Libor. That is the most important one in my opinion in terms of number of contracts that reference it. The 1 month has such short duration that I didn’t focus on it yet. The 6 month is interesting because it would have more credit risk and should reflect more differentiation. The same analysis would have to be done for every bank, every currency, and every spot on the curve to get a true estimation of how much LIBOR LYING was done. Determining, or guessing how much each bank lied would be critical to any lawsuit. Lawsuits will ultimately have to be tied to how much a bank lied, and how much of that lie impacted the LIBOR setting. The complex mechanism by which LIBOR is calculated means that not all (or possibly any) of a lie would impact LIBOR’s setting. In spite of Barclay’s rush to catch up, they were still being excluded from the LIBOR calculation on most days for being too high.
From this data, there is no way to prove anyone lied, or to prove by how much if they did.
Gut Feel
I have spent more time focused on Barclay’s and their US issues. So far, it looks to me like they were submitting LIBOR more accurately than other and their claims that others were too low seem right. I have more work to do, but am getting to the point where the damage to Barclay’s stock price is worse than the risk.
Concerns over JPM’s exposure seem overdone as well. Yes, they were at the low end of submissions, but I think it would be hard to prove that is a lie without some real evidence. They had low submissions, but their CDS and stock performed the best. I do not think that they can be sued just because they have a large book of business if they didn’t have material amounts of “lying”. Again, I’m not concluding anything yet, but fears related to them seem overdone from all the work I’ve done.
For some reason I want to say something bad about BAC, and my gut tells me I’m right, but as of now, they seem reasonable. Their LIBOR moved with their stock and CDS. Maybe they were slow occasionally, but if anything they come out better so far than I would have guessed.
Citi. It is impossible to say they did anything wrong from the data I’ve looked at, but their submissions don’t pass an initial smell test. If Barclay’s is saying banks were submitting LIBOR that was too low, they strike me as a candidate for much deeper scrutiny. Their stock and CDS did the worst, yet consistently during those peak times, they submitted LIBOR closer to the better performers. Again, it could be a function that it is so short dated, and a function that Barclay’s was so high they were being excluded, but I would want to take a closer look at Citi’s submissions and would be nervous that their stock does not fully reflect the risk.
We are not lawyers, and have no access to actual interbank trades from the time, and this is not a recommendation to buy or to sell, but if the market is going to throw around lawsuit numbers in the $20 billion to $50 billion range and move prices based on that, figuring out how real those numbers are and who would bear the brunt of the burden is key. From all of our work so far, any “manipulation” prior to August 2007 would have had minimal impact as all the submitters were so close together and there really wasn’t a “credit” problem so the fluctuations of LIBOR seem reasonable, at least within a bp or two.
More banks to look at, more points on the curve, and more historical bond prices to dig up.
